Why Your LLM Application Feels Slow
Introduction
You spend weeks building an AI-powered application. The model gives great answers. Then users start complaining that it feels slow. You look at the model's response time and it seems fine — so what is the problem?
Here is the key insight: LLM latency is usually not the model's fault. In most production systems, the model itself is only one of many stages that add delay. The real bottlenecks are architectural — how requests flow through your system, which operations happen sequentially when they could happen in parallel, and whether you are streaming output or waiting for the full response.
This article breaks down where latency actually comes from and how to fix it.
The Three Latency Metrics That Actually Matter
Before you can optimise latency, you need to know which type of latency you are dealing with. LLM latency decomposes into three distinct metrics, each with different causes and different fixes.
| Metric | Full Name | Definition | Target |
|---|---|---|---|
| TTFT | Time to First Token | Time from request sent to first token received | < 500ms |
| TBT | Time Between Tokens | Time between each successive output token | < 50ms |
| E2E | End-to-End Latency | Total time: TTFT + (TBT × number of output tokens) | Context-dependent |
Understanding which metric is degraded tells you where to look:
- High TTFT — the model is taking too long to start. Usually caused by long input prompts (large context windows take longer to process) or slow retrieval before the model call. This is what users experience as "thinking time" or "the AI is loading."
- High TBT — the model is generating tokens slowly. Usually a hardware or model efficiency issue (GPU memory bandwidth). Affects how smooth streaming feels.
- High E2E — the total wall-clock time. For short responses, TTFT dominates. For long responses, TBT accumulates and dominates.
Measure all three in your own application before optimising. Here is a code snippet that captures them using streaming:
import time
import anthropic

client = anthropic.Anthropic()
ttft = None
tokens = 0
start = time.perf_counter()

with client.messages.stream(
    model="claude-opus-4-5",
    max_tokens=512,
    messages=[{"role": "user", "content": "Explain transformers in 3 paragraphs."}]
) as stream:
    for text in stream.text_stream:
        if ttft is None:
            ttft = time.perf_counter() - start
        tokens += 1

e2e = time.perf_counter() - start
tbt = (e2e - ttft) / max(tokens - 1, 1)

print(f"TTFT: {ttft*1000:.0f}ms | TBT: {tbt*1000:.0f}ms | E2E: {e2e*1000:.0f}ms")
Where Latency Actually Comes From
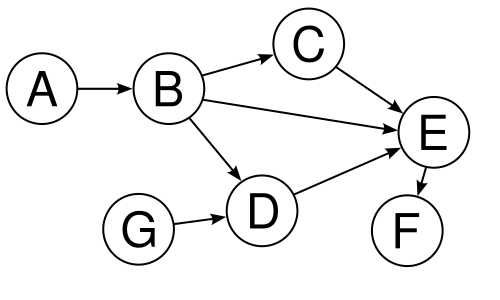
An LLM application is not a single API request. It is a pipeline of stages that each add delay. A typical request flows through:
Each stage adds delay. Even if each one is fast, they accumulate. And if they run sequentially — waiting for the previous stage to finish before starting — the total delay is the sum of all stages.
Bottleneck 1: Long Prompts Slow Down the Model
The LLM takes longer to start generating when it has a larger input to process. This is the prefill phase — before the model can output its first token, it must read and process your entire prompt.
Every extra token in your prompt adds to TTFT:
TTFT ≈ Function(number of input tokens)
Common sources of unnecessarily large inputs:
- Sending the full conversation history when only the last few messages are relevant
- Inserting complete documents when only one section is needed
- Repeating lengthy system instructions in every request
- Inserting verbose tool outputs without trimming them first
What to do about it
- Use rolling summarisation for long conversations instead of full history.
- Retrieve only the relevant chunk from a document — not the whole thing.
- Use prompt caching for large, repeated system prompts (so you pay once, not every request).
- Set a strict output length limit with
max_tokens.
Bottleneck 2: Network Overhead Accumulates
Network latency feels small per hop — but in a distributed AI system, there can be many hops.
Sources of network overhead:
- TLS handshake overhead on every new connection
- Cross-region latency if your inference service is in a different region from your application
- Cold start delays in serverless environments (the function needs to initialise before it can respond)
- Sequential API chaining — calling one service, waiting for the response, then calling another
What to do about it
- Maintain persistent connections to frequently used services instead of opening a new connection each time.
- Deploy inference services in the same region as your application server.
- Warm serverless functions to avoid cold start penalties for time-sensitive endpoints.
- Combine multiple small API calls into fewer larger calls where possible.
Bottleneck 3: Retrieval Latency in RAG Systems
If you are using RAG (Retrieval-Augmented Generation), retrieval adds latency before the model call even begins. A typical RAG request involves:
- Embedding the user's query (an API call)
- Searching the vector database (a database query)
- Optional reranking (another model call)
- Assembling the context from retrieved chunks
All of this happens before the LLM sees anything. In poorly designed systems, retrieval takes longer than the LLM inference itself.
Common retrieval mistakes that add latency
- Re-embedding the same query every time instead of caching frequent query embeddings
- Retrieving far more documents than needed (top-50 when top-5 would suffice)
- Running retrieval synchronously before any other processing begins
- Using hybrid search (dense + keyword) for every query when semantic search alone would suffice
What to do about it
- Cache embeddings for frequently repeated queries.
- Limit retrieval top-k aggressively — start with 5 and increase only if quality suffers.
- Start retrieval as soon as the user message arrives, before authentication and validation finish.
- Pre-trim document chunks during indexing so you never send oversized context to the model.
Bottleneck 4: Sequential Pipeline Execution
This is one of the most common and fixable causes of slow LLM applications. Many early implementations run every step sequentially:
- Validate the request. (50ms)
- Generate the query embedding. (100ms)
- Search the vector database. (80ms)
- Call the LLM. (2000ms)
- Log the result. (30ms)
Total: 2,260ms. But steps 1 and 2 do not depend on each other. Steps 4 and 5 do not need to overlap with anything, but logging can happen asynchronously. With parallelisation:
- Validate + begin query embedding simultaneously.
- As soon as embedding is ready, start vector search.
- Call the LLM.
- Log asynchronously in the background.
Total: potentially 2,050ms. Small improvements compound across every request.
Design principles for lower latency
- Start retrieval as early as possible — do not wait for unrelated validation steps.
- Stream model output immediately after the first token arrives.
- Move logging, analytics, and memory updates to asynchronous background tasks.
- Identify which pipeline stages genuinely depend on each other and which can run in parallel.
Streaming: The Most Important User Experience Fix
Streaming means the model starts sending words as it generates them, instead of waiting until the full response is ready. This is one of the most impactful changes you can make to how your application feels.
Here is why it matters: humans are very sensitive to silence. If an app does not respond for 5 seconds, it feels broken — even if the final answer arrives at second 5 and is excellent. With streaming, the user sees words appearing at second 1, second 2, second 3 — the experience feels responsive even though the total generation time has not changed.
Streaming should not be treated as a "nice to have" feature. For any interactive application, it is a fundamental design requirement. Users who see nothing for 5 seconds will assume the app is broken and refresh or leave.
Key Takeaways
- Latency is primarily a system architecture problem — audit the full pipeline before blaming the model.
- TTFT (time to first token) dominates user perception of speed — optimise for it specifically, not total generation time.
- In RAG systems, retrieval is frequently the dominant bottleneck — cache embeddings and limit top-k retrieval aggressively.
- Parallelise independent pipeline stages and make streaming non-negotiable for interactive applications.
Conclusion
When your LLM application feels slow, the instinct is to blame the model. But the model is usually not the problem. The real causes are architectural: sequential stages that could run in parallel, large inputs that slow down the prefill phase, retrieval pipelines that add seconds before the model even starts, and missing streaming that makes users wait in silence.
Optimising latency means auditing your pipeline as a whole, not just the model call. Measure TTFT, TBT, and E2E separately. Find the actual bottleneck. Then fix that — not the model.
Speed matters as much as accuracy in real-world applications. A slow but accurate app will be abandoned. A fast and accurate app will be used.
References
- Kwon, W., et al. (2023). Efficient Memory Management for Large Language Model Serving with PagedAttention. SOSP 2023.
- Leviathan, Y., Kalman, M., & Matias, Y. (2023). Fast Inference from Transformers via Speculative Decoding. ICML 2023.
- Dao, T., et al. (2022). FlashAttention: Fast and Memory-Efficient Exact Attention with IO-Awareness. NeurIPS 2022.
- vLLM Documentation — Efficient LLM Serving
- Pope, R., et al. (2023). Efficiently Scaling Transformer Inference. MLSys 2023.