A Beginner’s Guide to Mean Absolute Error (MAE)
Mean Absolute Error (MAE) is one of the simplest and most intuitive metrics for evaluating regression models. It measures the average absolute difference between actual and predicted values, providing a clear interpretation of model accuracy in the same units as the target variable.
Formula
The formula for MAE is:
\[ MAE = \frac{1}{n} \sum_{i=1}^{n} |y_i - \hat{y}_i| \]
Worked Example
Consider the following dataset of actual vs predicted values:
| Actual | Predicted | Absolute Error |
|---|---|---|
| 250 | 260 | |250 - 260| = 10 |
| 400 | 390 | |400 - 390| = 10 |
| 450 | 470 | |450 - 470| = 20 |
| 500 | 480 | |500 - 480| = 20 |
| 550 | 560 | |550 - 560| = 10 |
Now, we add up all the absolute errors:
\[ 10 + 10 + 20 + 20 + 10 = 70 \]
Then, divide by the total number of observations (n = 5):
\[ MAE = \frac{70}{5} = 14 \]
So the Mean Absolute Error for this dataset is 14.
Visualizing MAE
1. Actual vs Predicted
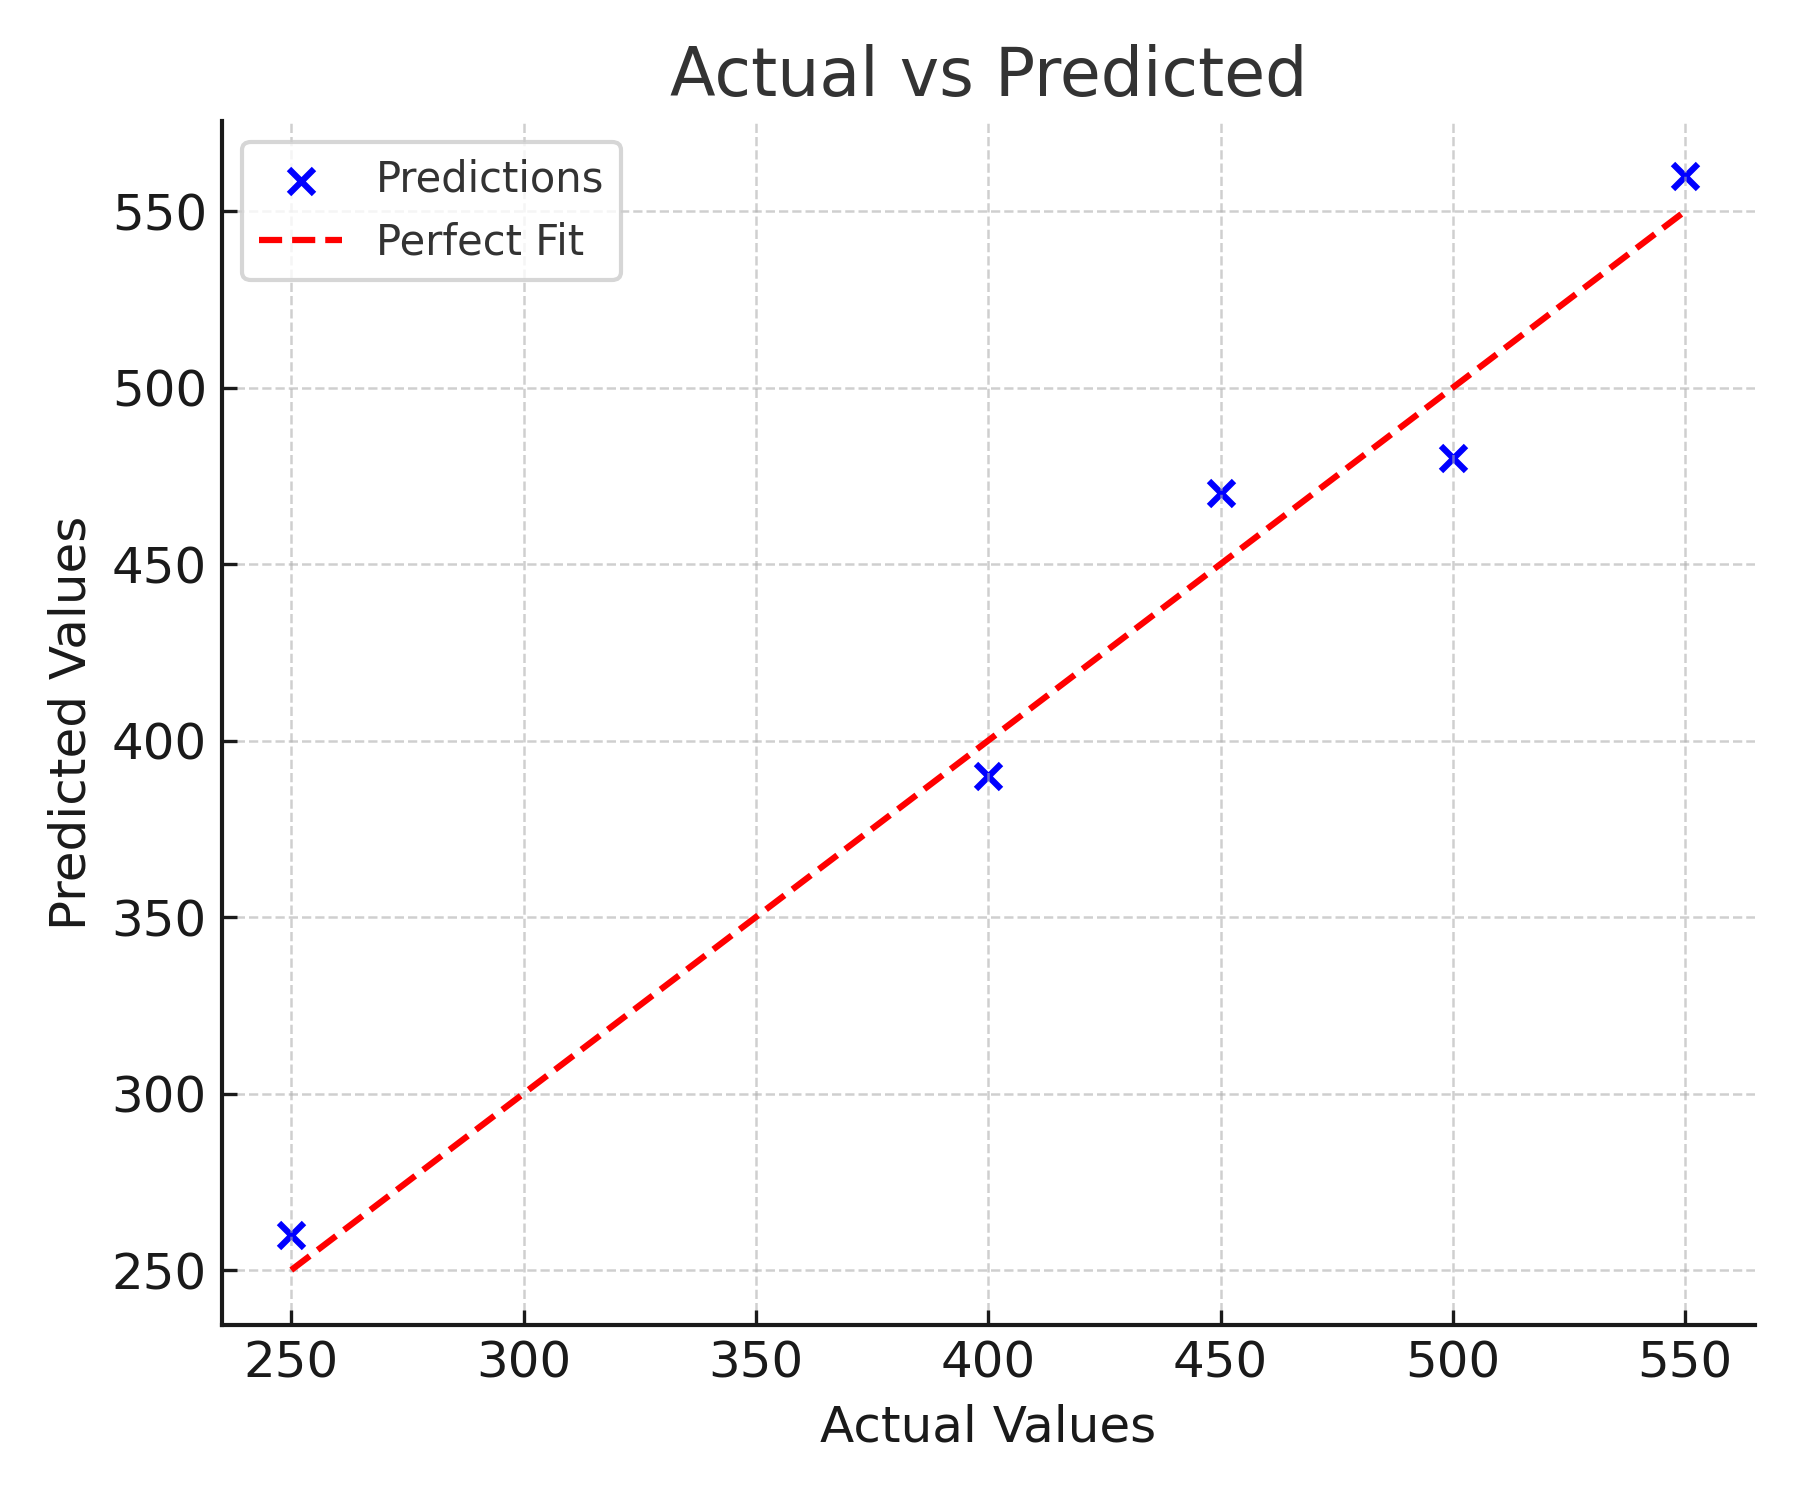
Explanation: This chart compares the model’s predictions to the actual values. The red dashed line represents a perfect prediction line (where predicted = actual). Points closer to the line indicate better accuracy, while larger deviations show prediction errors.
2. Residuals (Absolute) vs Predicted
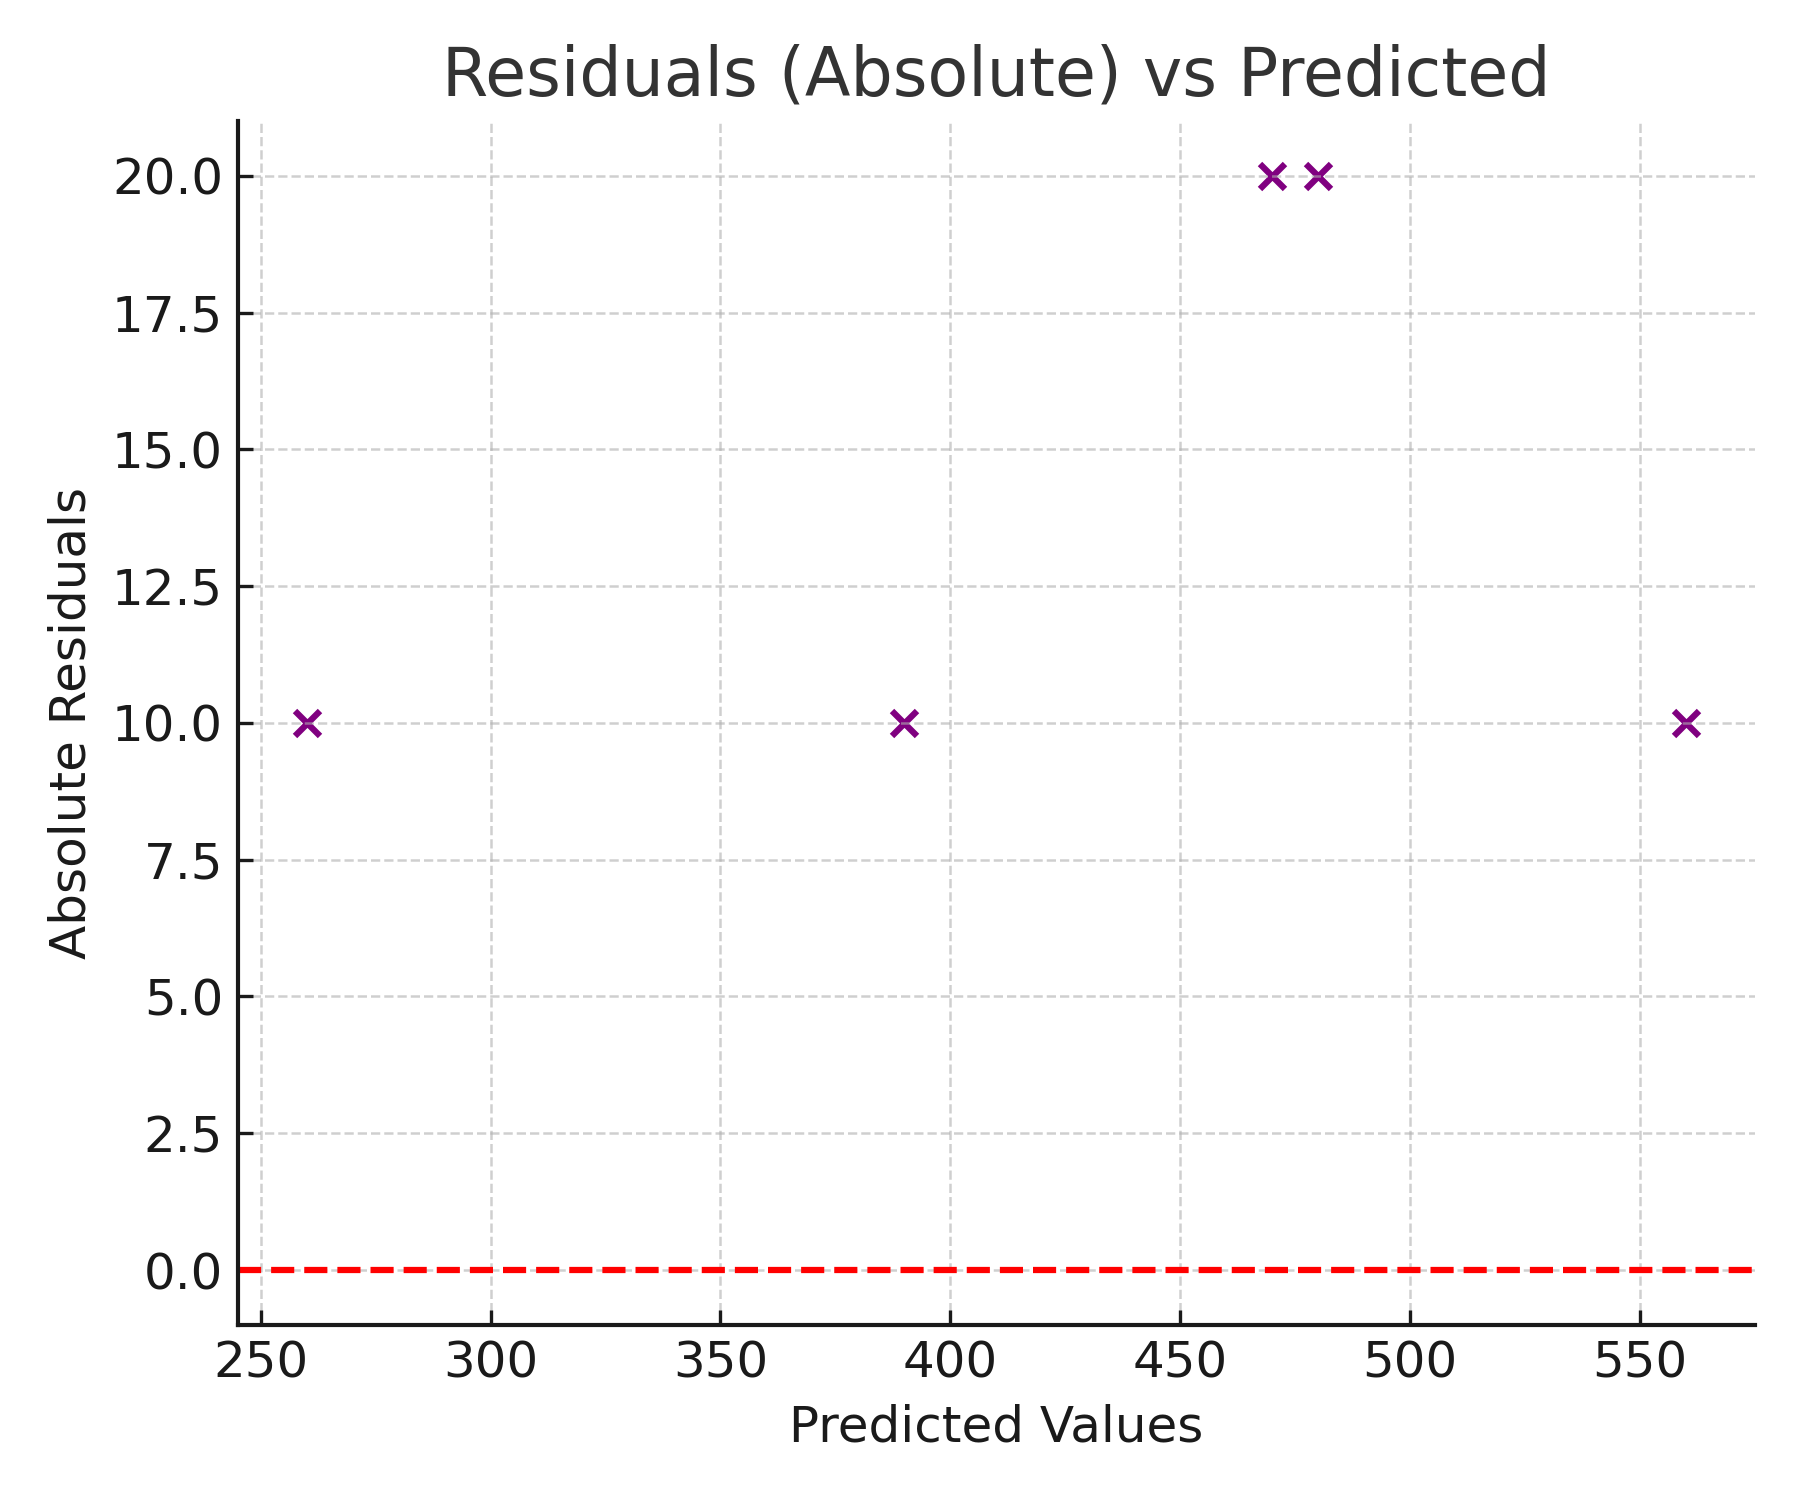
Explanation: This plot shows the size of the errors (absolute residuals) relative to the predicted values. Ideally, residuals should be small and evenly scattered. Large residuals indicate where the model struggles to make accurate predictions.
Python Example
import numpy as np
from sklearn.metrics import mean_absolute_error

actual = [250, 400, 450, 500, 550]
pred   = [260, 390, 470, 480, 560]

mae = mean_absolute_error(actual, pred)
print("MAE:", mae)
Key Takeaways
- MAE is simple and intuitive, measuring the average error in the same units as the target variable.
- Unlike RMSE, it does not penalize large errors more heavily than small errors.
- Great for interpretability but may not always highlight rare, large errors.