RMSE Explained: The Complete Beginner’s Guide
Introduction
Whenever we build a predictive model whether it’s estimating house prices, sales numbers, or tomorrow’s temperature we need to check how accurate those predictions are.
One of the most common ways to measure this accuracy is something called RMSE, which stands for Root Mean Squared Error. The name may look intimidating, but it’s actually a very logical idea with a rich mathematical history. Let’s break it down step by step, look at where it comes from, and explore why it matters, using a real example and clear visuals.
1. What Is RMSE ?
RMSE is a single number that tells you, on average, how far your model’s predictions are from the actual values measured in the same units as the thing you are predicting.
- If RMSE is small, your predictions are typically close to reality.
- If RMSE is large, your predictions are often far off.
Think of it like the “typical distance” between what your model predicts and what actually happens.
A Simple Analogy
Imagine you are throwing darts at a target. Each dart is a prediction, and the bullseye is the actual value. RMSE is like measuring the average distance of all your darts from the center, but with a twist: it gives extra weight to darts that miss badly.
2. Where RMSE Comes From
RMSE has its origins in statistics and the method of least squares estimation, which dates back to the early 19th century.
- Mathematicians like Carl Friedrich Gauss and Adrien-Marie Legendre developed the method of least squares to find the best-fitting line through data.
- The idea was to minimize the sum of squared errors the squared differences between observed values and model predictions.
From this framework:
- Mean Squared Error (MSE) became a natural way to measure average squared deviations.
- Root Mean Squared Error (RMSE) is simply the square root of MSE, which brings the measure back to the original units so it is easier to interpret.
Why Square the Errors?
Squaring the errors does two important things:
- Eliminates negatives so positive and negative errors do not cancel each other out.
- Penalizes large mistakes more heavily than small ones.
For example, a 20-unit mistake hurts four times more than a 10-unit mistake because \(20^2 = 400\) while \(10^2 = 100\). This is why RMSE is especially useful when big errors are costly and you want a model that avoids them.
3. The Formula
The formula for RMSE is:
$$ \mathrm{RMSE} = \sqrt{\frac{1}{n}\sum_{i=1}^{n} \bigl(y_i - \hat{y}_i\bigr)^2} $$
It simply means:
- Take each actual value (\(y_i\)) and subtract the predicted value (\(\hat{y}_i\)) to get the error.
- Square each error.
- Average all the squared errors.
- Take the square root.
4. Example
Consider this small dataset of house sizes (X) and actual selling prices (Y):
| Size (sq.ft.) | Actual Price (Y) |
|---|---|
| 1000 | 250 |
| 1500 | 400 |
| 2000 | 450 |
| 2500 | 500 |
| 3000 | 550 |
Suppose a model predicts these prices:
| Size (sq.ft.) | Predicted Price |
|---|---|
| 1000 | 260 |
| 1500 | 390 |
| 2000 | 470 |
| 2500 | 480 |
| 3000 | 560 |
Step 1 – Find the Errors
| Size | Actual | Predicted | Error (Actual − Predicted) |
|---|---|---|---|
| 1000 | 250 | 260 | -10 |
| 1500 | 400 | 390 | +10 |
| 2000 | 450 | 470 | -20 |
| 2500 | 500 | 480 | +20 |
| 3000 | 550 | 560 | -10 |
Step 2 – Square the Errors
| Error | Squared Error |
|---|---|
| -10 | 100 |
| +10 | 100 |
| -20 | 400 |
| +20 | 400 |
| -10 | 100 |
Step 3 – Find the Average
$$ \mathrm{MSE} = \frac{100 + 100 + 400 + 400 + 100}{5} = \frac{1100}{5} = 220 $$
Step 4 – Take the Square Root
$$ \mathrm{RMSE} = \sqrt{220} \approx 14.83 $$
This means that on average, our model’s predictions are about 15 price units away from the real prices.
5. Seeing RMSE Visually
Numbers are helpful, but visuals make RMSE easier to understand. Below are three charts that show the same data from different perspectives. Together, they make the concept of RMSE much more intuitive.
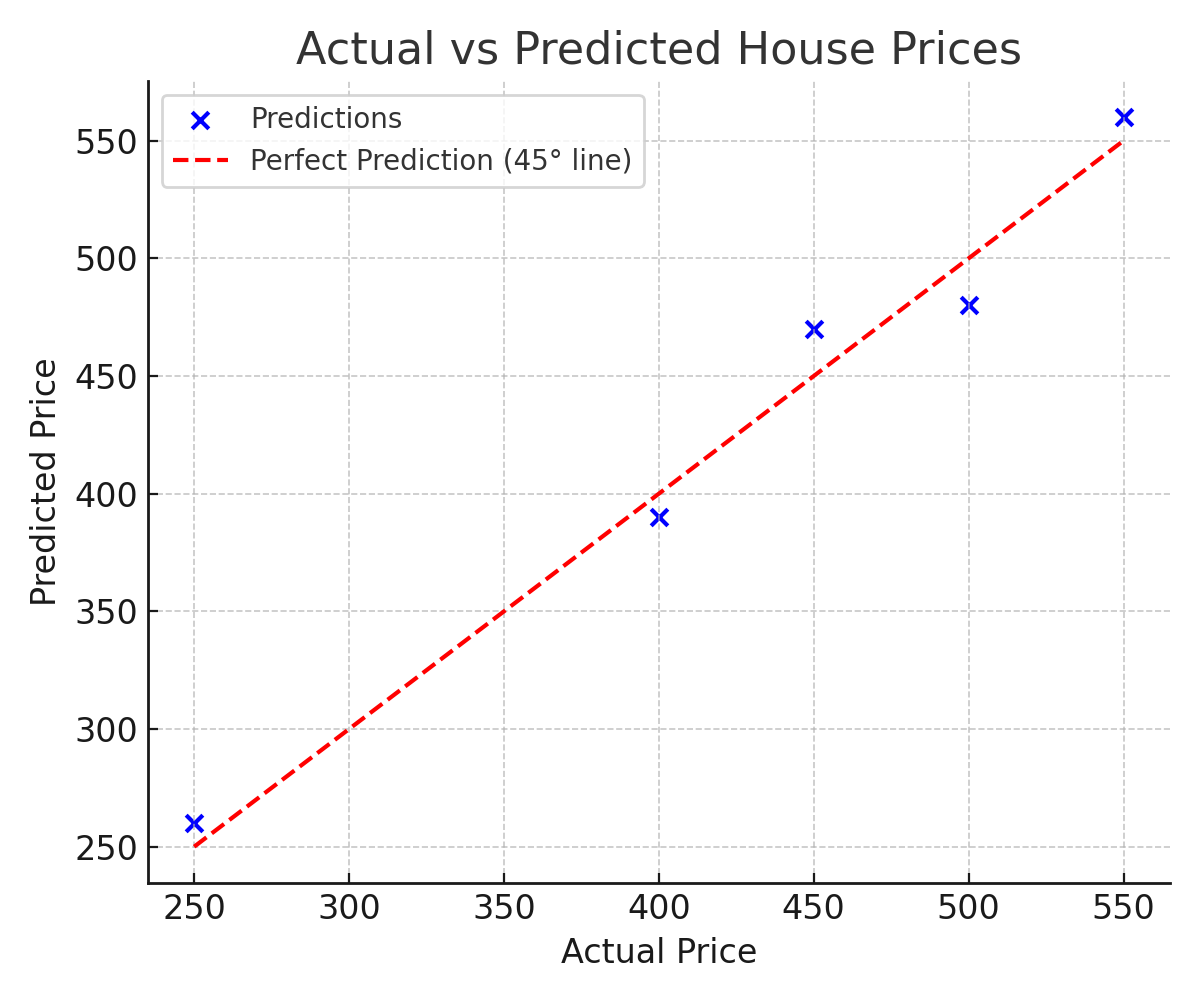
Actual vs. Predicted Prices
This scatter plot compares the actual house prices (x-axis) with the predicted prices (y-axis). The dashed diagonal line represents perfect prediction. Points close to the line indicate accurate predictions; points above the line mean the model predicted too high; points below the line mean it predicted too low. The vertical distance from each point to the line is the prediction error. RMSE summarizes all of these distances into a single number.
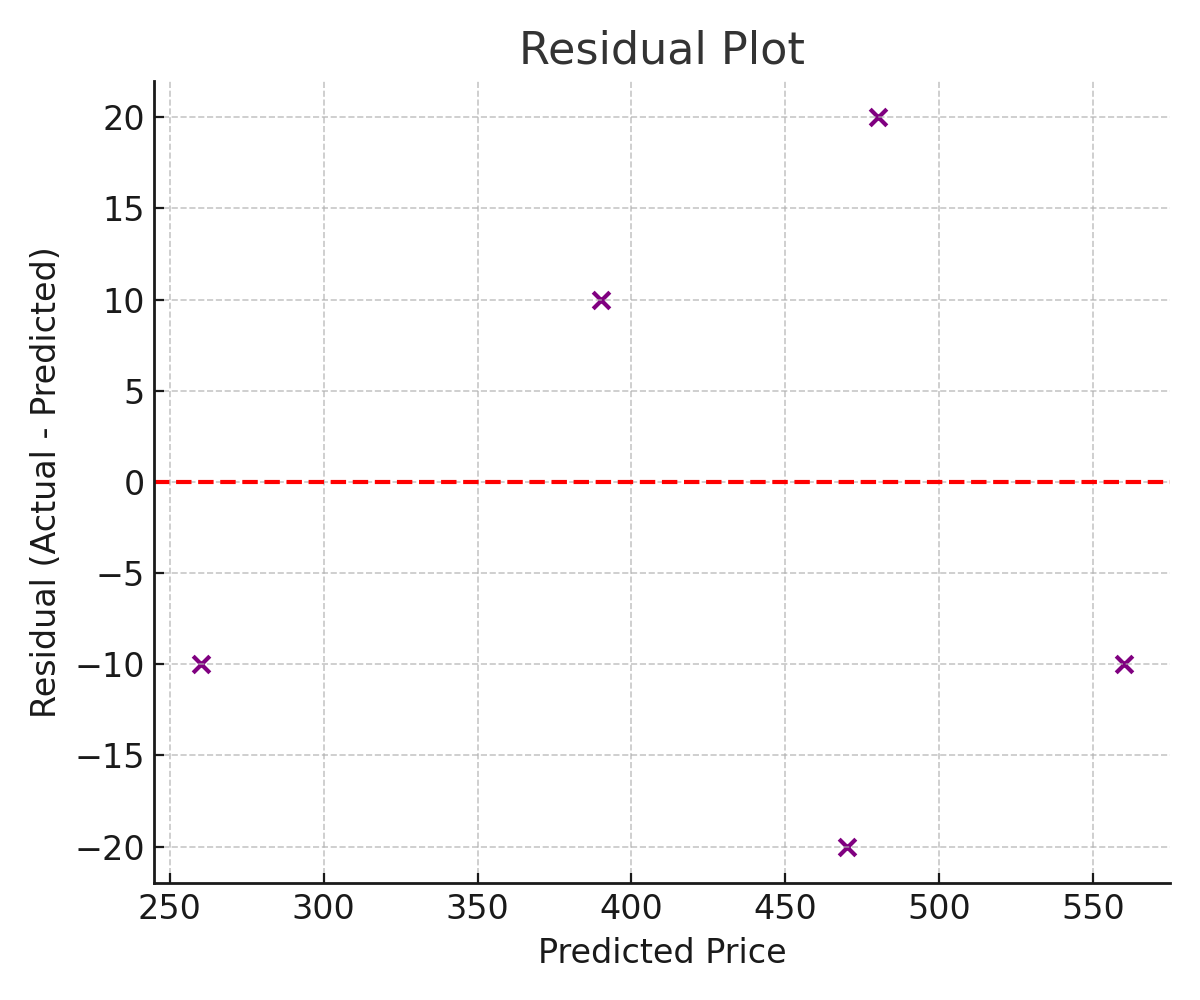
Residual Plot
This plot shows the residuals (actual minus predicted) on the y-axis and the predicted price on the x-axis. The horizontal zero line represents perfect predictions. Points close to zero indicate small errors, while points far above or below zero represent larger mistakes. Large deviations heavily influence RMSE. Patterns in the residuals can indicate if the model is missing important relationships in the data.
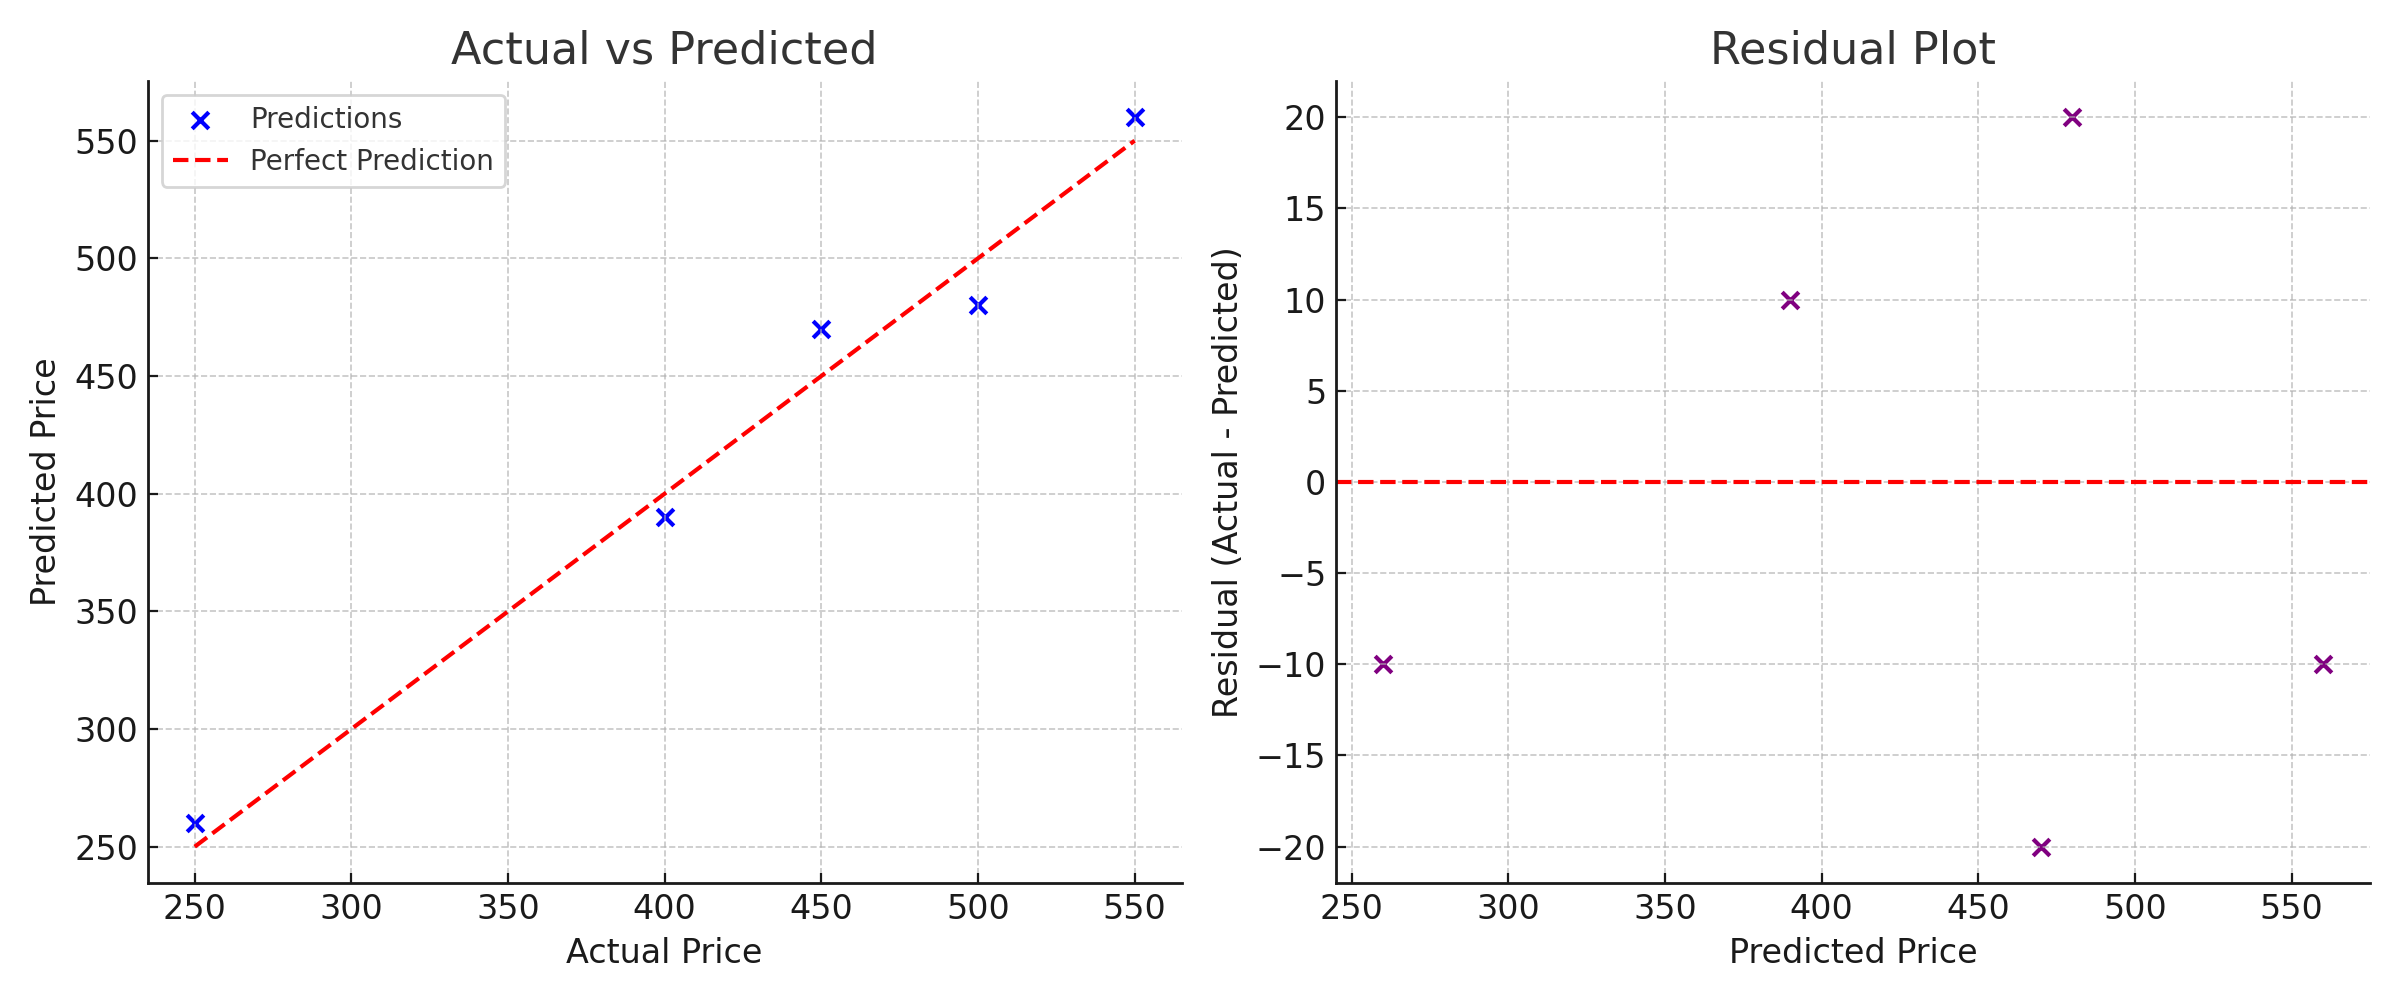
Combined View
Finally, here is a combined chart showing the Actual vs. Predicted plot on the left and the Residual Plot on the right. Viewing them together provides both a direct comparison and an error analysis in one glance.
6. Quick Python Code
import math

actual = [250, 400, 450, 500, 550]
pred   = [260, 390, 470, 480, 560]

squared_errors = [(a - p)**2 for a, p in zip(actual, pred)]
mse  = sum(squared_errors) / len(squared_errors)
rmse = math.sqrt(mse)

print("RMSE:", rmse)   # Output: 14.83
7. Why RMSE Is So Popular
RMSE remains one of the standard metrics in data science and statistics because:
- It is easy to interpret: the result is in the same units as your data.
- It is mathematically grounded: directly tied to the least squares method.
- It penalizes large errors, which is valuable in fields like finance, healthcare, and engineering where big mistakes can be costly.
However, RMSE is sensitive to outliers. If your data contains extreme values, it is often wise to also check other metrics such as Mean Absolute Error (MAE) for a more balanced view.
8. Key Takeaways
- RMSE is the square root of the average squared prediction errors.
- It comes from the least squares tradition developed by Gauss and Legendre.
- Lower RMSE indicates better model performance.
- Use RMSE when large errors matter and you want a measure that is easy to interpret in the same units as your target variable.
References
- Statistics by Jim – Root Mean Square Error (RMSE)
- Wikipedia – Mean Squared Error
- Wikipedia – Root Mean Square Deviation
- Copernicus GMD – RMSE vs. MAE Discussion
- Gauss, C.F. (1809). Theoria Motus Corporum Coelestium – Early work on least squares.